 XpectraFlow docs
Accessing logs
The support bundle — one click, one JSON file, everything we need to diagnose your instance.
When something is wrong and the error code does not explain it, the console can package the whole picture — runtime, database health, your workspace's shape, and recent logs — into a single file you can send us.
Where the button is
Bottom-left of the sidebar, second icon along, between Support (?) and
Documentation (the book):
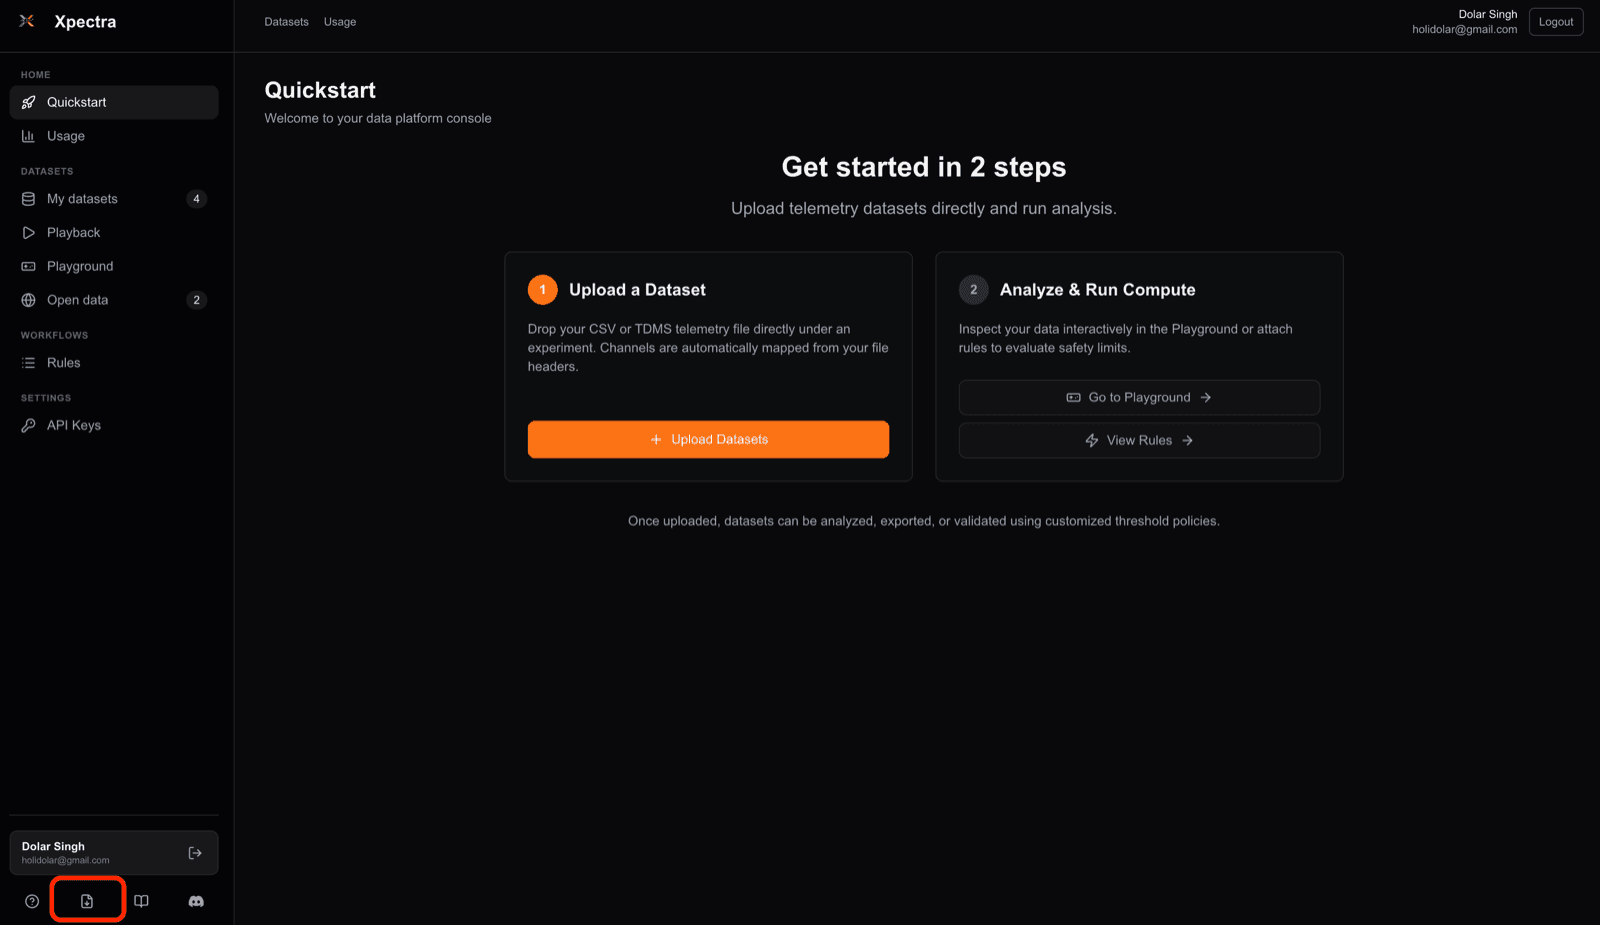
Click it. The icon becomes a spinner while the bundle is assembled, then the file downloads and a toast confirms it.
You must be signed in. The endpoint behind the button —
GET /api/support/bundle — is session-authenticated, not API-key
authenticated, and returns 401 to anything else. There is no way to generate
a bundle from a script, deliberately: it reads your workspace's contents, and a
static key in a config file is the wrong credential for that.
What you get
A single JSON file named after the moment you clicked:
support-2026-08-06T12-14-53-118Z.jsonThat name is also the bundle's requestId, and it appears inside the file. Quote
it to us and we can find the exact generation in our own logs.
The file is pretty-printed JSON — readable in any editor, diffable between two runs, and greppable.
What is inside
| Key | What it holds |
|---|---|
runtime | Node version, platform, arch, uptime, memory usage, and which env vars are configured — never their values |
database | Postgres version, TimescaleDB extension version, row counts per table, dataset and experiment status breakdowns, and every hyper-* table with its estimated rows and on-disk size |
organizationSnapshot | Your user, your organization, and its recent experiments, datasets, channels, rules and API key metadata |
logs.recentFileLogs | The last 1000 lines of the structured application log on disk |
logs.recentBufferedLogs | The last 500 entries from the in-process ring buffer — including anything the server wrote to console.error / console.warn |
logs.browserDiagnostics | The last 500 client-side diagnostics reported by the console in your browser |
logs.docker | The last 500 log lines from each running xpectra-consumer, xpectra-web, timescaledb, minio and redis container, with timestamps |
The organizationSnapshot lists are capped — 50 experiments, 100 datasets, 500
channels, 100 rules, 100 keys, newest first. A workspace larger than that is
represented by its most recent slice, which is almost always the part the
problem is in.
What is deliberately not inside
No secrets and no telemetry. The bundle excludes password hashes, API key
hashes, telemetry ingest keys, raw environment variable values, and every row of
your actual telemetry. API keys appear as keyPrefix, scopes and timestamps
only.
This is also written into the file itself, under privacy.redactedFields, so
whoever receives it can see the guarantee without taking anyone's word for it.
Channel names and units are included — they are the thing most likely to explain a mapping bug — so if a channel name is itself sensitive, look before you send.
Sending it to us
The file is inert JSON. Attach it however is easiest:
Email. Send it to arush@xpectraflow.com with
the requestId in the subject line. Typical bundles are a few hundred kilobytes
— well inside any attachment limit.
Drive, Dropbox, S3 — any link. Upload it and share the link. Use this when
the bundle is large (a busy instance with verbose Docker logs), or when your mail
gateway strips .json attachments. Grant access to the address above rather than
making the link public.
Discord. Drop it in a thread on our server if that is already where the conversation is happening.
Whichever route, tell us what you were doing and roughly when. The bundle says what the system looked like; only you can say what you expected.
Generate it at the right moment
The bundle is a snapshot, not a recording. recentBufferedLogs is a 500-entry
ring buffer and recentFileLogs is a 1000-line tail — on a busy instance, a
failure from an hour ago may already have rolled out of both.
So: reproduce the problem, then click the button. A bundle generated the next morning frequently contains no trace of the thing it was meant to explain.
When logs.docker says it is unavailable
"docker": {
  "available": false,
  "command": "docker ps / docker logs",
  "error": "spawn docker ENOENT"
}
Expected on any deployment where the web process cannot reach the Docker CLI — a managed host, or a container without the socket mounted. Everything else in the bundle is still valid and still useful; the consumer's own logs are simply not in it.
On a self-hosted box you can collect them yourself alongside the bundle:
docker logs --tail 500 --timestamps xpectra-consumer > consumer.logWhat it will not tell you
The bundle describes the platform. It says nothing about whether a specific API call failed, because that call never touched this process's logs in a form tied to your request.
For that, use the request_id on the failing response — see
Errors and debugging. Best case, send
both: the request_id for the one request, and the bundle for the state it
happened in.